

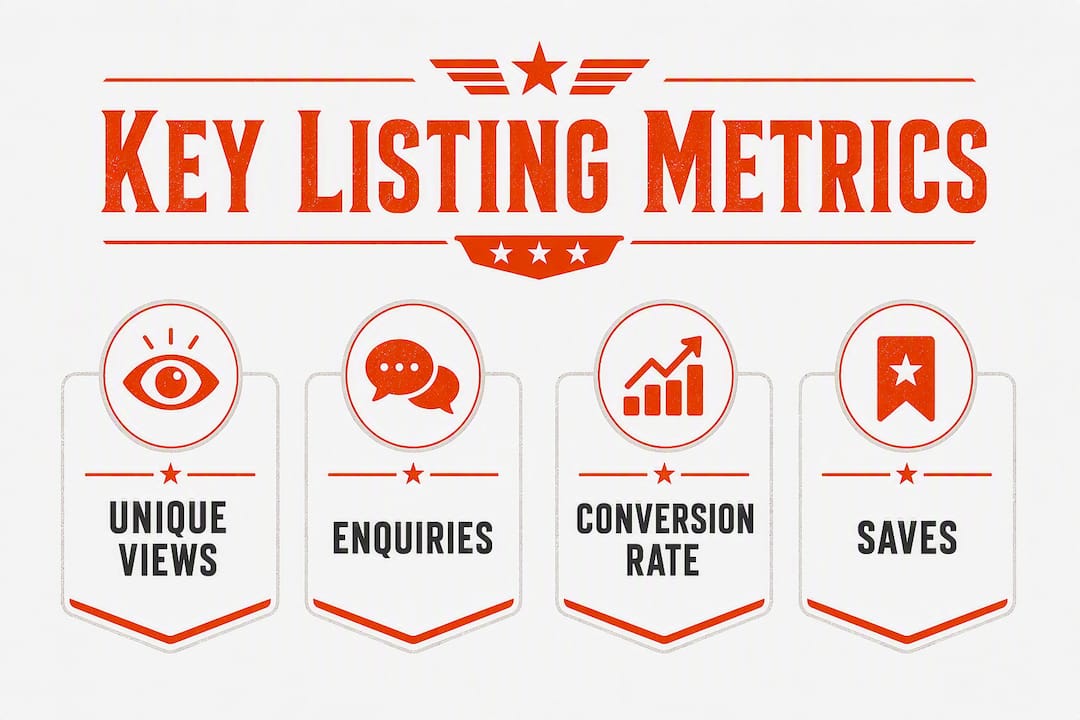
The most effective way to track commercial vehicle listing analytics is to monitor six core metrics every week: views, enquiry count, enquiry conversion rate (enquiries ÷ views), saves, contact clicks, and days-to-sell. Those six numbers tell you whether a listing needs a price adjustment, a photo refresh, or a promotional push. Set up your data collection through Sostruckforsale's dealer dashboard as your primary source, layer in Google Analytics with UTM-tagged share links, and pipe leads into HubSpot CRM or a Google Sheet. Then run this cadence:
- Daily: Check paid ad spend, impressions, and click-through rate (CTR) on any promoted listings.
- Weekly: Sort all active listings by lowest enquiry conversion rate. Fix the bottom performers before spending on promotion.
- Monthly: Review model-level enquiry rates and days-to-sell to guide acquisition decisions.
Pro Tip: Set up a Looker Studio dashboard connected to your Google Analytics property so your weekly listing health review takes under 10 minutes. One shared link, no spreadsheet hunting.
Table of Contents
- What metrics should you track for every commercial vehicle listing?
- How do you collect reliable listing data across platforms?
- How do you analyze listing patterns to find what's working?
- What actions should you take when analytics flag a problem?
- What should your reporting dashboard and cadence look like?
- How Sostruckforsale analytics informed one dealer's inventory decisions
- Which tools should US dealers use to build their analytics stack?
- Key Takeaways
- Why listing data matters more than most dealers realize
- Sostruckforsale gives dealers the data to sell smarter
- Useful sources and further reading
What metrics should you track for every commercial vehicle listing?
Every vehicle listing is a data point; richer data reveals patterns that separate high-converting listings from poor performers. The table below gives you standard definitions you can paste directly into a tracking spreadsheet.

| Metric | Definition | Formula |
|---|---|---|
| Views (unique) | Distinct visitors who loaded the listing page | Platform report |
| Enquiries (leads) | Contacts submitted or calls initiated from the listing | Platform report |
| Enquiry conversion rate | Share of viewers who became leads | Enquiries ÷ Views |
| Saves / wishlist | Buyers who bookmarked the listing | Platform report |
| Contact clicks | Clicks on phone, email, or chat buttons | Platform report |
| Impressions | Times the listing appeared in search results | Platform report |
| CTR | Share of impressions that became clicks | Clicks ÷ Impressions |
| Days-to-sell | Calendar days from listing live to sale | Sale date − List date |
| Time-on-page | Average seconds a visitor spent on the listing | Google Analytics |
Worked example — enquiry conversion rate: A 2019 Kenworth T680 receives 140 views and 7 enquiries in 30 days. Enquiry conversion rate = 7 ÷ 140 = 5%. If your inventory average is 3%, that unit is outperforming. If it is 1%, something in the presentation or price is blocking buyers.
Worked example — ROI on a promoted listing: You spend $150 to feature a listing for two weeks. Views rise from 60 to 210, enquiries from 1 to 6. If your gross margin on that unit is $4,500 and you close one additional deal, the ROI is ($4,500 − $150) ÷ $150 = 29x. That calculation should precede every promoted-ad decision.
Stat to know: Marketplace reporting tools now rank top-performing vehicles over a rolling 30-day period, giving dealers exposure, activity, and market insights in a single view.
How do you collect reliable listing data across platforms?
Marketplace native reports are the fastest starting point. Sostruckforsale's dealer dashboard surfaces views, contact clicks, and enquiry counts per listing without any additional setup. The limitation is that native reports rarely show traffic source, so you cannot tell whether a buyer found you through organic search, a shared link, or a paid ad.
UTM tagging checklist — apply these parameters to every link you share outside the marketplace:
utm_source— where the link lives (e.g.,facebook,email,craigslist)utm_medium— the channel type (e.g.,social,email,cpc)utm_campaign— the campaign name (e.g.,kenworth-t680-june)utm_content— the specific creative or ad variant (e.g.,photo-a,photo-b)utm_term— optional keyword for paid search campaigns
Test every tagged URL in Google Analytics under Reports → Acquisition → Traffic acquisition before running a campaign. A broken UTM means lost attribution data.
Capturing leads in HubSpot CRM or Google Sheets:
- Standardize lead form fields: listing ID, vehicle make/model/year, contact date, contact method, and lead source.
- Record a timestamp for every enquiry so you can calculate time-to-first-response alongside conversion rate.
- Map each lead record back to its listing ID so offline sales data (the actual closed deal) can be reconciled with online metrics later.
Pro Tip: If HubSpot is not yet in your budget, a Google Sheet with a simple form (Google Forms → Sheet) captures the same fields at no cost. The discipline of recording listing ID on every lead matters more than the tool you use.
How do you analyze listing patterns to find what's working?
Start with the views-to-enquiries funnel. Pull 30-day data for every active listing, sort by enquiry conversion rate, and group by vehicle type, model year, and price band. The comparison across similar units is where the real signal lives.
Segmentation checklist:
- Vehicle type: separate trucks, trailers, excavators, and other equipment categories.
- Region: if you list nationally, filter by buyer zip code or inquiry origin.
- Price band: group listings into $0–$25K, $25K–$75K, $75K–$150K, and $150K+ tiers.
- Listing age: flag any listing live more than 21 days with declining weekly views.
- Traffic source: compare enquiry rates from organic search vs. direct vs. paid.
Diagnostic rules:
| Pattern | Likely cause | First action |
|---|---|---|
| High views, low enquiries | Price or presentation issue | Refresh photos, rewrite headline, test price |
| Low views, any enquiry rate | Visibility or search ranking problem | Add keywords to title, check category placement |
| Declining views after 3 weeks | Listing has gone stale | Price review or full listing refresh |
| High enquiries, slow days-to-sell | Pricing or qualification mismatch | Tighten description, add financing info |
Pro Tip: Use short date ranges (7–14 days) to catch recent shifts after a listing change, and longer ranges (60–90 days) to spot seasonal demand patterns. Comparing one period to the prior period shows movement, not just a snapshot.
What actions should you take when analytics flag a problem?
High views with low enquiries almost always point to a presentation problem, not a vehicle problem. Fix the listing before spending on promotion.
Optimization checklist (run in this order):
- Price: Compare to three comparable active listings. A 3–5% price reduction often restores enquiry momentum without sacrificing margin.
- Photos: Add a minimum of 10 images. Lead with the driver's side exterior, then cab interior, engine bay, and any notable condition details. Reorder so the strongest image is first.
- Headline: Include year, make, model, and one key spec (e.g., "2020 Peterbilt 389 — 550HP, 13-Speed, Low Miles").
- Data fields: Fill every available field: mileage, engine hours, GVWR, axle configuration, and service history.
- Condition notes: Add a plain-language paragraph describing actual condition, recent service, and any known issues.
A/B test template:
- Hypothesis: Replacing the current lead photo with a cab-interior shot will increase CTR by at least 20%.
- Variant: Swap photo order on listing A; leave listing B unchanged.
- Duration: 14 days minimum, or until each variant has at least 100 views.
- Success metric: Enquiry conversion rate delta between A and B.
Spend on a featured or promoted listing only after completing the optimization checklist. Analytics identify high-performing inventory by the relationship between views and enquiries; promoting a low-conversion listing amplifies a problem, not a strength.
Timing guidelines: Daily checks on paid ad spend and CTR. Weekly listing cleanup on the bottom-quartile enquiry rate units. Monthly inventory acquisition reviews using model-level rolling 30-day enquiry rates.
What should your reporting dashboard and cadence look like?
Build your dashboard around five KPI panels: average enquiry rate across all active listings, slow movers (enquiry rate below 2% for two consecutive weeks), top performers (enquiry rate above 6%), ad spend vs. leads generated, and conversion rate by traffic source.
| Cadence | Focus | Who acts |
|---|---|---|
| Daily | Paid ad CTR, spend pacing, alert flags | Sales or marketing lead |
| Weekly | Listing health: sort by enquiry rate, fix bottom 20% | Inventory manager |
| Monthly | Model-level enquiry rate, days-to-sell, acquisition decisions | Principal or GM |
| Quarterly | Inventory strategy, seasonal demand, budget reallocation | Leadership team |
Alert thresholds to configure: Flag any listing whose enquiry rate falls below 2% for two consecutive weeks. Flag any listing with zero enquiries after 10 days live. Route alerts to the inventory manager by email or Slack.
Treat analytics as directional guidance rather than exact counts. Privacy settings and browser configurations can limit tracking accuracy, so focus on relative shifts and trends over time rather than single-day absolute numbers.
How Sostruckforsale analytics informed one dealer's inventory decisions
A dealer listing Class 8 sleeper trucks on Sostruckforsale ran a weekly metric review across 18 active listings. The review surfaced a clear pattern: two Freightliner Cascadia listings were generating enquiry conversion rates above 7%, while three comparable Kenworth T680 listings sat below 2%.
| Listing | Views (30-day) | Enquiries | Conversion rate | Action | Outcome |
|---|---|---|---|---|---|
| Freightliner Cascadia A | 210 | — | — | Prioritized similar acquisitions | Sold in 18 days |
| Freightliner Cascadia B | — | 13 | — | Allocated featured ad budget | Sold in 14 days |
| Kenworth T680 (avg) | — | 3 | — | Photo refresh + price test | Enquiry rate improved noticeably |
The workflow: weekly metric pull from the Sostruckforsale dealer dashboard → identify models with rolling 30-day enquiry rates above 5% → flag those models as acquisition priorities → shift promoted listing budget to the top-converting units.
Pro Tip: Set a model-level acquisition threshold: if a specific make/model/trim combination holds a 30-day enquiry rate above 5% for two consecutive months, add it to your buying list. That rate is evidence to prioritize stocking those assets.
- Pull model-level data monthly, not just listing-level data.
- Compare enquiry rates across model years to find the sweet spot buyers prefer.
- Use days-to-sell alongside enquiry rate; a unit with a high enquiry rate but slow days-to-sell may have a pricing or financing friction point.
Which tools should US dealers use to build their analytics stack?
Build from simplest to most integrated. A small dealer can get meaningful data from native reports and a Google Sheet alone. Larger operations benefit from the full stack.
Implementation priority:
- Native marketplace analytics (Sostruckforsale dealer dashboard) — zero setup, immediate data on views, clicks, and enquiries per listing.
- UTM tagging — free, takes one hour to implement, unlocks traffic-source attribution in Google Analytics.
- Google Analytics 4 — free, tracks time-on-page, traffic sources, and goal completions from your listing share links.
- Looker Studio — free Google tool; connect your GA4 property and build a live dashboard with the KPI panels described above.
- HubSpot CRM (Starter) or Google Sheets — captures lead records, maps them to listing IDs, and enables offline-to-online reconciliation.
Integration notes:
- Map listing ID as a custom dimension in GA4 so every session ties back to a specific unit.
- Export monthly data to Excel or Google Sheets for reconciliation with your DMS or sales records. Online metrics and offline sales data rarely live in the same system, and the spreadsheet is the bridge.
| Tool | Cost | Primary use | Best for |
|---|---|---|---|
| Sostruckforsale dashboard | Included with listing | Views, enquiries, contact clicks | All dealers, first step |
| Google Analytics 4 | Free | Traffic source, time-on-page | Dealers with a website or share links |
| Looker Studio | Free | Live KPI dashboard | Weekly reporting cadence |
| HubSpot CRM Starter | Paid | Lead capture, attribution | Dealers managing 20+ leads/month |
| Google Sheets | Free | Lead log, offline reconciliation | Small dealers or GA fallback |
Key Takeaways
Dealers who track enquiry conversion rate weekly and fix low-performing listings before promoting them consistently reduce days-to-sell and make better acquisition decisions.
| Point | Details |
|---|---|
| Six metrics drive decisions | Track views, enquiries, enquiry conversion rate, saves, contact clicks, and days-to-sell on every listing. |
| Fix before you promote | High views with low enquiries signals a presentation problem; optimize photos, price, and copy before spending on featured ads. |
| Weekly cadence is the core habit | Sort listings by lowest enquiry conversion rate every week and act on the bottom 20% before the next review. |
| Model-level data guides buying | A rolling 30-day enquiry rate above 5% for a specific make/model is a reliable signal to prioritize acquiring more of that unit. |
| Sostruckforsale as your starting point | The Sostruckforsale dealer dashboard provides views, enquiries, and contact clicks per listing with no additional setup required. |
Why listing data matters more than most dealers realize
Most dealers underestimate how much signal is sitting in their listing metrics right now, unused. The conventional wisdom is that a unit either sells or it doesn't, and that price is the only lever. That framing misses the point. A listing with 200 views and 2 enquiries is not a pricing problem by default. It may be a photo problem, a headline problem, or a missing spec problem. The enquiry conversion rate tells you which lever to pull before you touch the price.
The other thing dealers consistently overlook is the acquisition signal. When a specific model holds a high enquiry rate across multiple listing cycles, that is the market telling you what buyers want. Using that data to inform what you buy next is where listing analytics cross from operational tool to competitive advantage.
Sostruckforsale gives dealers the data to sell smarter
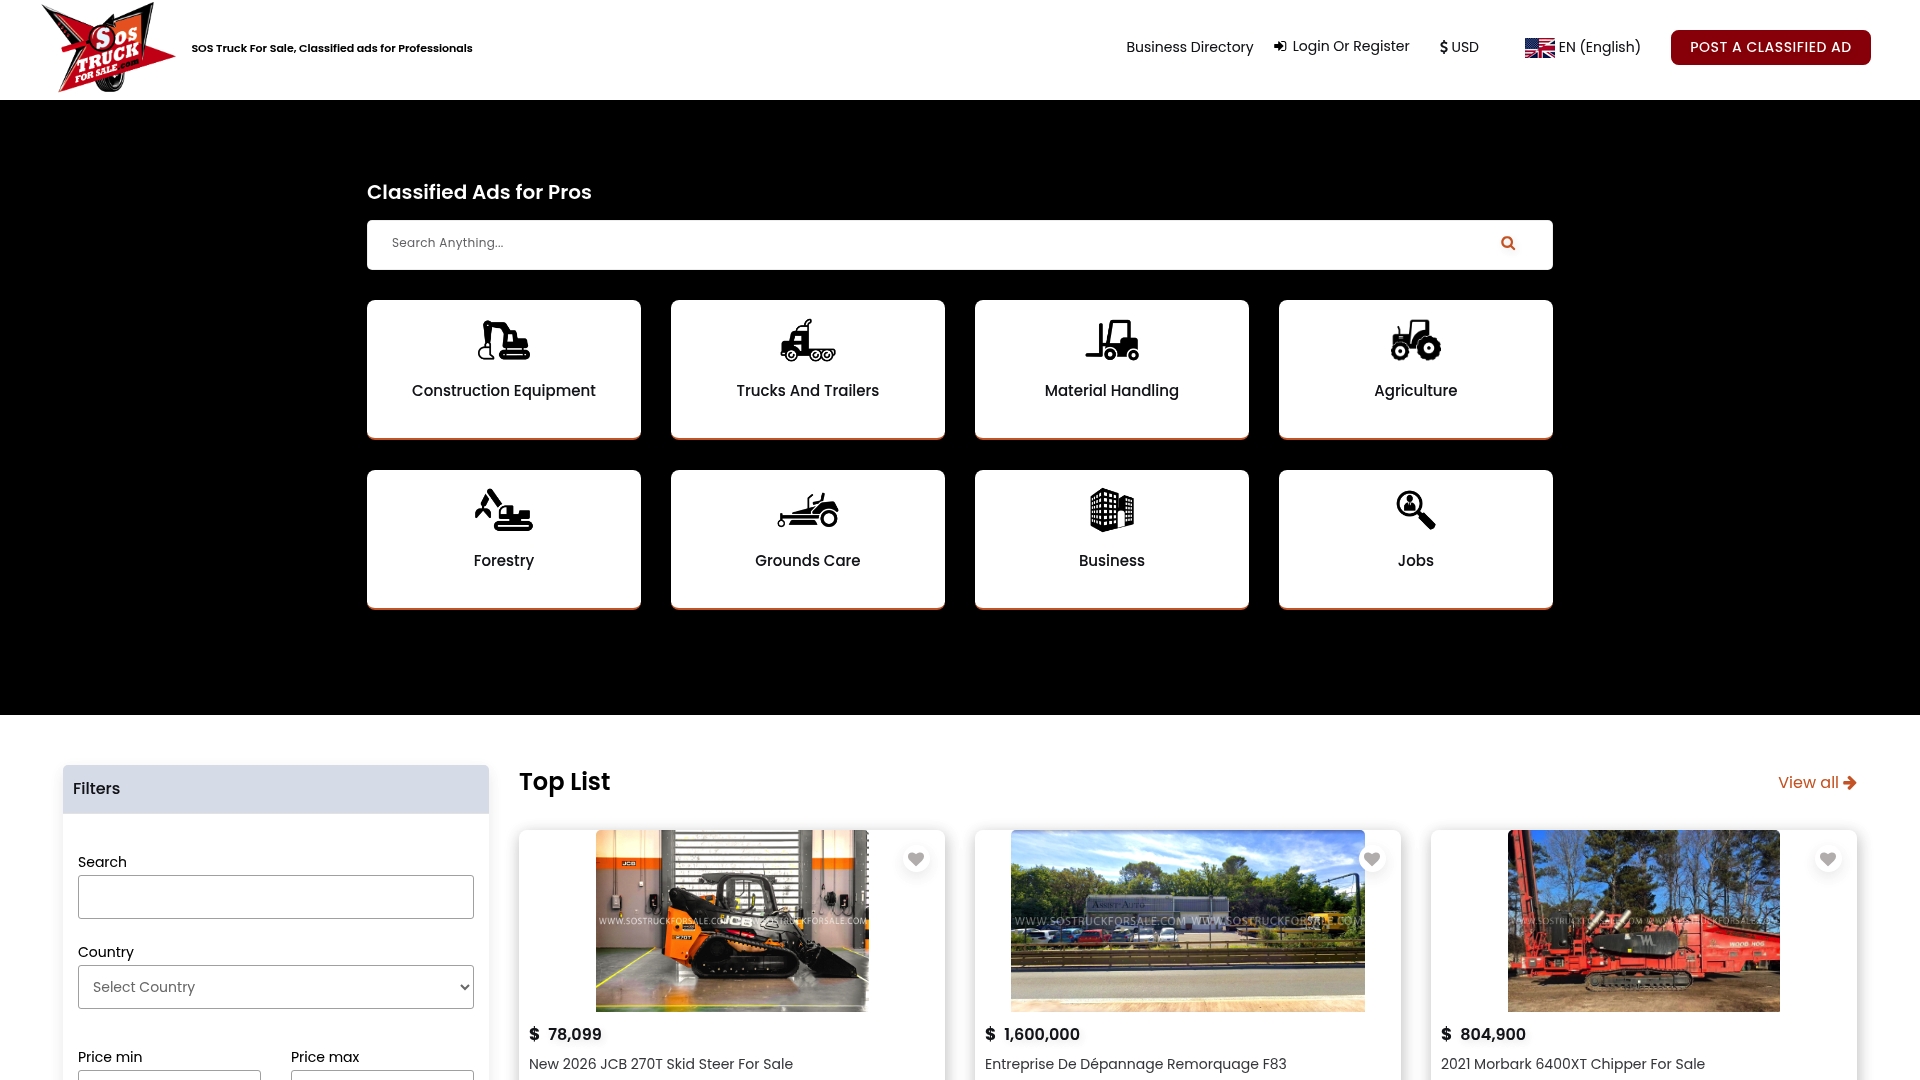
Dealers who list on Sostruckforsale get direct access to per-listing performance data through the dealer dashboard, including views, contact clicks, and enquiry counts, without any third-party setup.
Three features that support an analytics-driven workflow:
- Dealer dashboard: Per-listing views, enquiries, and contact clicks updated regularly so you can run your weekly review without leaving the platform.
- Promoted listings: Featured ad placement available once your listing passes the optimization checklist, with performance data to calculate ROI before you commit budget.
- Listing completeness checks: The platform flags missing fields (mileage, engine specs, photos) so every listing goes live with the data buyers need to make contact.
List your commercial trucks and equipment on Sostruckforsale and start your first weekly metric review this week.
Useful sources and further reading
Marketplace analytics and listing optimization
- Using listing data to improve vehicle sales (US dealers) — best for understanding enquiry rate benchmarks and model-level analysis.
- How to track car listing views and performance — covers the three-week declining-views rule and acquisition signals.
- How to use listing analytics to improve deal performance — strong on A/B testing methodology and the refresh-first principle.
Analytics tooling and implementation
- Heavy truck parts analytics dashboard — practical guidance on trend-based reporting and alert thresholds for heavy equipment.
- Commercial Truck Trader dealer platform and reporting tools — industry context on rolling 30-day performance ranking and dealer reporting features.
Industry context
- Empowering commercial vehicles through data-driven methodologies (MDPI) — academic foundation for KPI-based vehicle health and performance tracking.